 BPN-TRACK
The fuel graph inside the replay bar
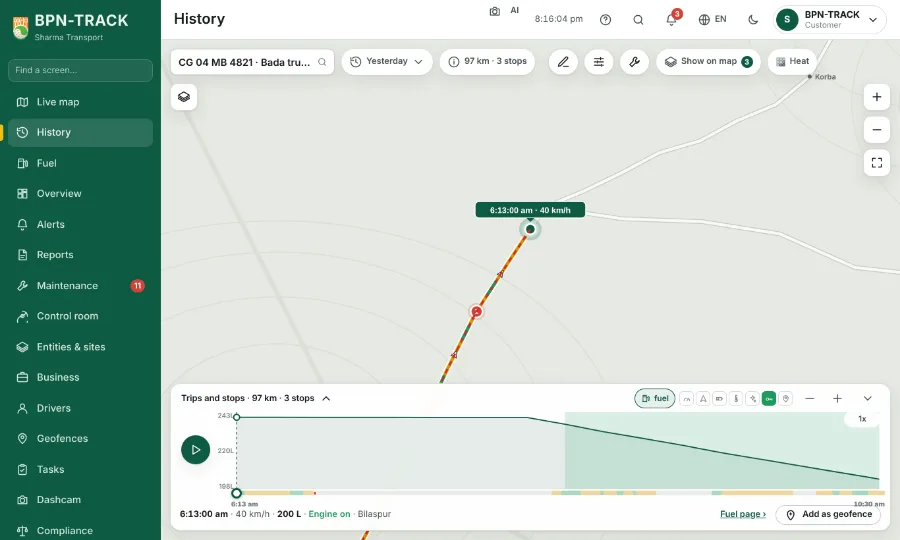
Open the vehicle's fuel graph right under the map while you replay, one cursor for both.
How to
- On History, pick a vehicle with a fuel sensor and a day.
- On a computer, tap the arrow on the replay bar (Open the fuel graph). On a phone, pull the replay bar up with a finger.
- The bar grows into a compact fuel graph for the same vehicle and time: the fuel line, the engine-on bands, every refill and drain with its litres, the speed colours as a thin strip under it, Play in the corner. The map stays open and the vehicle sits in the middle of what you can see.
- The small icons in the graph's header add speed, battery, temperature, engine or stops over it, as on the Fuel screen. The line shows the level's real ups and downs over the whole day; drag on the graph and the cursor follows your finger or mouse until you let go.
- Press Play, drag the strip or tap the graph: the graph's cursor, the knob and the vehicle on the map move together. "Fuel page" opens the full graph with Compare and Mark event as false.
- Tap the arrow again (on a phone, pull the bar down) to close the graph.